In this post, we highlight a few simple things that you might want to keep an eye on when you look at your author website analytics, what those numbers actually mean, and more importantly and how you can learn from this data to make your content and marketing work even harder for you. At first, this might be a little intimidating for you. Don’t worry. It’s not.
If you’re using our Publish Fox website builder then you will already have received a walkthrough of your author website analytics and how best to interpret it. But for those who are yet to join our gang we just wanted to share the love…
First things first – go to Google Analytics > Home
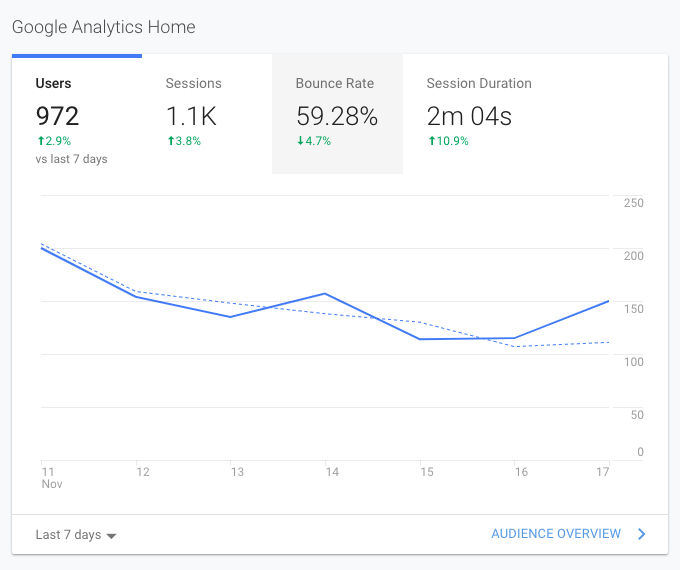
The first thing you’ll see is your Google Analytics Home report.
This graph gives you a high-level overview of four of the key data points:
- Users – The number of unique visitors over a set time period.
- Sessions – How many visits to your site over a set time period. Remember: One user can visit multiple times so this number will always be equal to or higher than Users.
- Bounce Rate – How many visitors have left your site without visiting a second page over a set time period. Remember: A high number here is BAD!
- Session Duration – How long the average visitor stayed on your author website over a set time period.

This image shows data over the last 7 days. Positive trends are always displayed in green, and negative trends are shown in red.
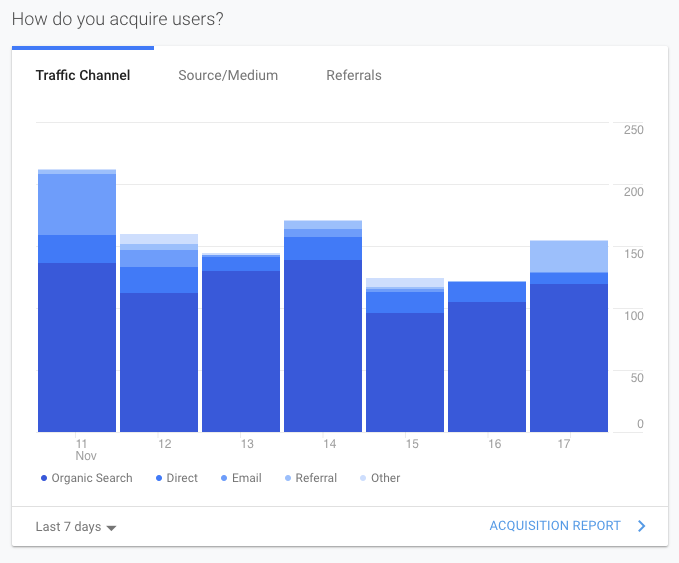
Travel further down the page and you’ll see your next report – How do you acquire users?

This report will give you an immediate picture of where your author website traffic comes from.
But hold on for a second. This data can be used to help inform your marketing strategy. So where is your traffic coming from? In an ideal world, your traffic should be neatly divided across the three primary sources: organic search, social and direct traffic (i.e. people typing in your website URL).
The reason for balance is that if one declines, your site still has other traffic sources. For example, if Google changes their algorithm and your site falls from page 1 to page 5 in the search results, you will still have social and direct to keep the traffic coming. If you do see that these numbers are out of kilter then you might want to invest some time in finding a better balance.
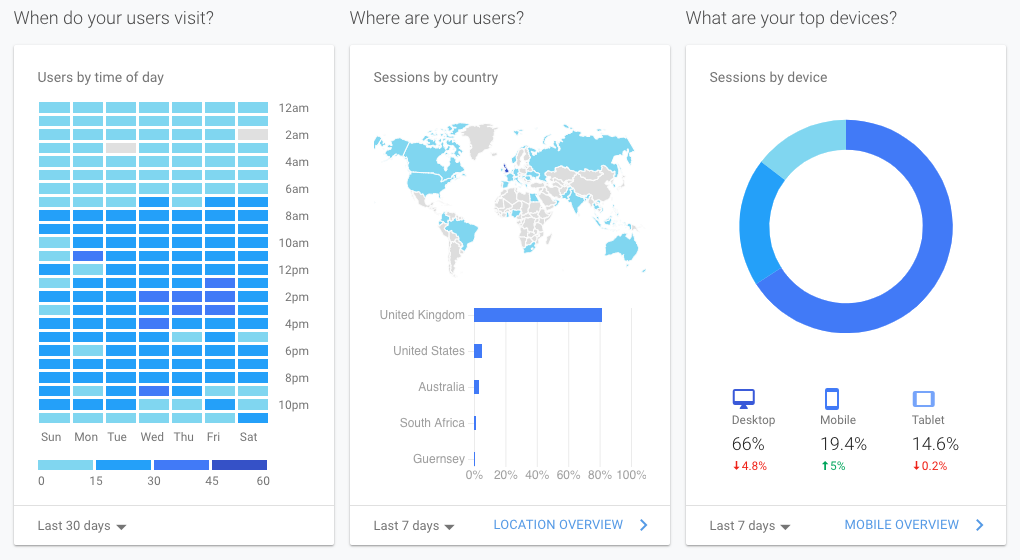
Moving further down we get to your next set of reports: When do your users visit? Where are your users? What are your top devices?
 These three reports can help guide and inform your overall content strategy.
- Understanding where the majority of your audience lives can help you to localise and personalise your blog articles.
- Insight into when your audience visits your site will help you plan when you should be posting your new content.
- What platforms are people visiting your site on? And more importantly what platforms are they leaving your author website on? Think about it – if 50% of people visit your author website on mobile and the bounce rate on mobile is significantly higher than desktop or tablet, then that may be a sign that your site isn’t easily usable to your mobile audience.
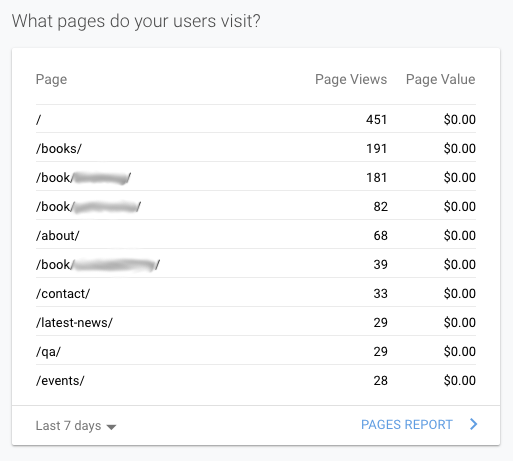
And then we get to the final report – What pages do your users visit?

This will show you your top pages and give you a quick idea of what content is performing and which pages aren’t.
Now, this might surprise you. You might discover that the vast majority of your traffic goes to your homepage. Other authors see exactly the opposite – their blog posts are the primary drivers of traffic and that hardly anyone even sees their homepage. This can give you a clue as to how people are finding your site and what they’re doing when they’re there.
There is so much that you can learn about author website analytics from your Google Analytics dashboard – what’s working and what’s not – you just have to know how to interpret the data.
What next?
If you’re an Author then we would recommend that you check up on your author website analytics on a regular basis. User behaviour changes in the blink of an eye, and so do sources of traffic, and this will impact how your pages are indexing. If you want to make sure that your website is the first port of call for your fans and readers then a bit of analysis on a monthly basis is a really good idea.
Good luck, and remember to sign up to our newsletter for more hints and tips specifically for Authors direct to your inbox every month. And if you want help getting your Google Analytics set up properly, and interpreting it, then get in touch with us today for a chat about how we could help you.
